MIAS BLOG #1...10/3
Blog #1...pre calc...10/3/06
Sketches of graphs from real-world information-
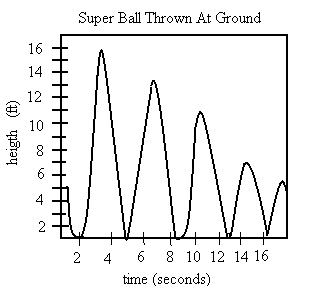
Graphs really do represent real life situations even though only about .00005 of the earth's population seems to actually use them in these instances. For example, if i threw a super ball at the ground and wanted to make a graph to represent what it did, the graph would probably look like this:


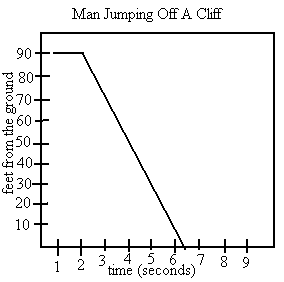
This is because as time goes on, the ball bounces and goes higher, then comes back down and bounces (but not as high this time) and so on until it finally stops. A graph of somebody jumping off a cliff would probably look like the line above...
It would look like this because he starts on the top of the cliff at 80 ft then jumps off and over the next 51/2 secons falls to the ground (zero feet).
Familiar kinds of functions from previous courses and from this unit -
some types of functions we reviewed this year are as follows.
linear functions are y=mx+b. They make a straight line on a graph.

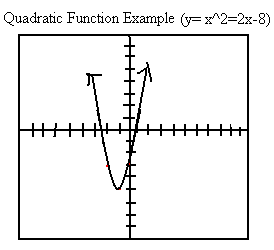
quadratic functions make parabolas and the equation for one is y=ax^2+bx+c.
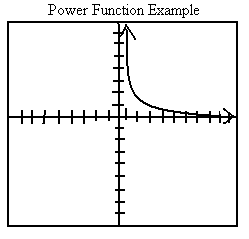
power functions are represented by the equation y=ax^b. these graphs level out at zero.


an exponential function starts out at zero and goes up from there.
How to dilate and translate the graph of a function - Translation is when a line or equation of a graph is moved either up, down, or to either side but the original figure doesn't change. The original line is labeled f(x) and when you move it up or down using Vertical Translation you would write, for example, y=f(x)-4 to move it down four units or y=f(x)+10 to move it up ten units.
Horizontal Translation is when you move the line left or right on the graph. This is shown by y=f(x-7) if you're moving the line positive seven units or y=(f+2) if you're moving it negative two units.
When you dilate a graph, you either streach it out or squish it together.
Horizontal Dilation could be represented by y=f(1/3x) and to draw the dilation, you would make all the points on the x axis three times the distance from the y axis as they were before (because the number on the bottom of the fraction is a three).
Vertical Dilation could be shown by y=2f(x) or y= 1/2f(x) or something. the number that you're using is on the outside of the "f(x)". to show y=2f(x) you would move all the points on the y axis twice as far from the x axis as they were before. this is because it was multiplied by two.
Any difficulties or misconceptions you have but overcame -
I pretty much understood everyhting once I had practiced it for a while.
Any topics about which you are still unsure-
I'm not very sure I understand negative and absolure values dilations. I think I could do it if I was looking at the homework but not on my own. I was gone the day we learned that :( no problem though... ill get it eventually.
- My Favorites
- Search
- Recent comments
- Comment from pattyo:
Thanks for your post, Mia. :)Let me know if you still ...